
Trans identification really is in free fall: New data
And so is nonbinary identity.


A firestorm erupted last week when Prof. Eric Kaufmann made a bold claim: Identifying as transgender is “in free fall among the young.”

But as journalist Benjamin Ryan rightly pointed out, these surveys didn’t measure identifying as transgender. Instead, they measured identifying as nonbinary (note the chart says “not identifying as male or female,” which is not the same as identifying as transgender). Another journalist, Erin Reed, criticized Kaufmann’s analysis for not using survey weights. Kaufmann has since responded to both critiques.
Wondering which side was right, last week I analyzed data from the nationally representative Household Pulse survey, which asked directly about identifying as transgender and which is a better population-wide indicator than the elite schools in Kaufmann’s graph. The Household Pulse data showed a decline in trans ID among 18- to 22-year-olds in 2024, but I was cautious about drawing conclusions from it as the decline appeared only in a limited time period (July to September 2024) and two of the three survey administrations added an option for nonbinary identification that wasn’t there before. Maybe that was why identifying as trans declined.
Then, over the weekend, I found it – a nationally representative survey that asked about transgender identification in the same way from 2021 to 2024. It also asked separately about identifying as nonbinary.
It turns out identifying as transgender really is in free fall among the young in the U.S. So is identifying as nonbinary. In other words, Kaufmann was right (with what some consider the wrong data, but still right).
Among 18- to 22-year-olds, trans identification was cut nearly in half from 2022 to 2024. Nonbinary identification dropped by more than half between 2023 and 2024 (see Figure 1; the data are from the Cooperative Election Study (CES), fielded each year in the fall by YouGov and administered by Tufts University).
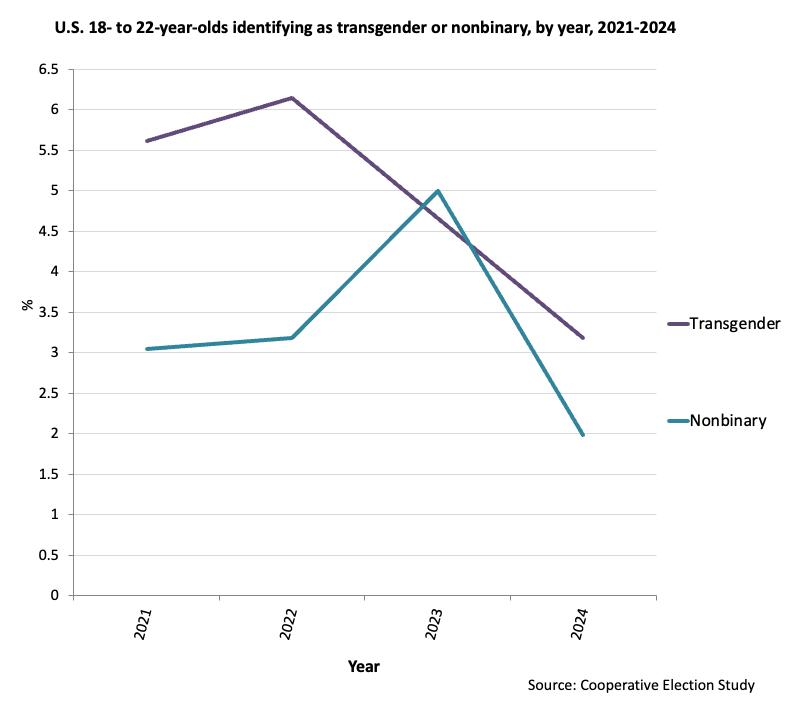
Figure 1: Percent of U.S. 18- to 22-year-olds who identify as transgender or nonbinary, 2021-2024. Source: Cooperative Election Study (CES). Note: Transgender identity was not assessed in 2023. Data are weighted. Analyzed by Jean M. Twenge for the Generation Tech Substack.
Year of birth plays a key role here. Americans born in the early 2000s were more likely to identify as transgender than those born before or after them (see Figure 2). That was also true for identifying as nonbinary, though with a less pronounced up and down pattern.
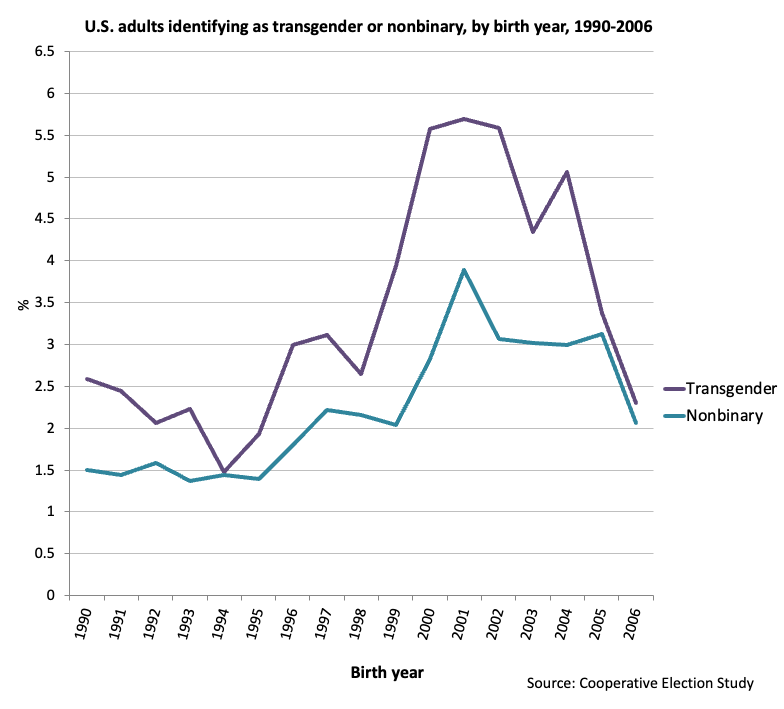
Figure 2: Percent of U.S. adults who identify as transgender or nonbinary, by birth year, 1990-2006. Source: Cooperative Election Study. Note: Transgender identity was not assessed in 2023. Data are weighted. Analyzed by Jean M. Twenge for the Generation Tech Substack.
Including all birth years with 100 or more respondents (1933-2006) shows the pattern even more starkly (see Figure 3). Among Silents, Boomers, and Gen X’ers (those born before 1979), less than .5% identified as transgender or nonbinary, with the number at a flat zero in some earlier birth years. Those numbers begin to rise with Millennials (born 1980-1994) and continue upward with Gen Z (born after 1995) until they abruptly plummet with those born in the mid-2000s.
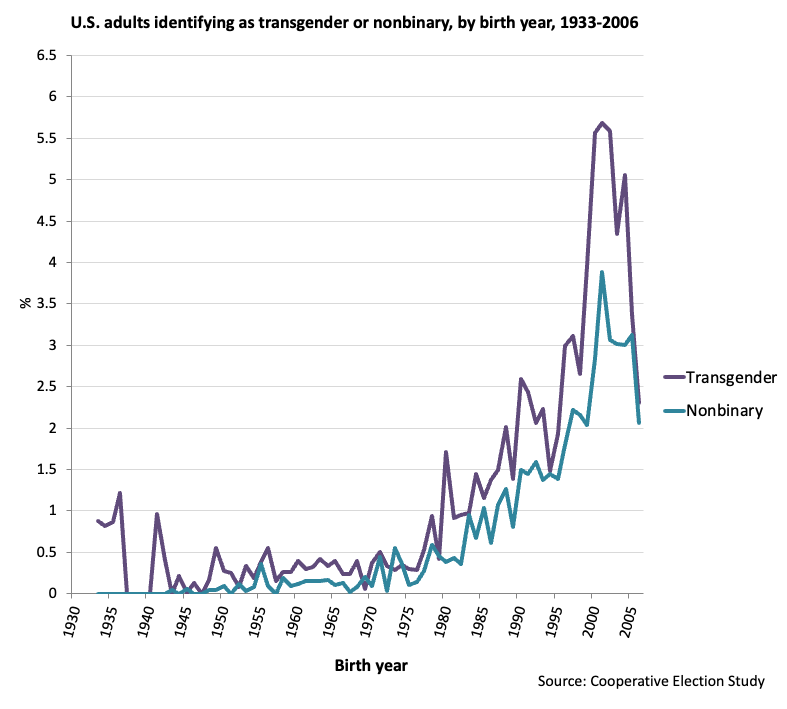
Figure 3: Percent of U.S. adults who identify as transgender or nonbinary, by birth year, 1933-2006. Source: Cooperative Election Study. Note: Transgender identity was not assessed in 2023. Data are weighted. Analyzed by Jean M. Twenge for the Generation Tech Substack.
One caveat: We don’t have 2025 data from the CES yet, so we can’t tell if this trend will continue. CES is partially funded by the National Science Foundation, so it’s possible the survey will not ask about or report data on transgender or nonbinary identification this year due to the Trump administration’s mandate on not acknowledging gender identity. I hope they do, though, as that will be the only way to know that the 2024 data aren’t a blip.
For now, however, it looks like the peak of trans identification is in the past.
Do you find any correlations with public awareness? Advocacy groups, speakers, and school attitudes? I appreciate your analysis, but to evaluate we need to see error bars, especially when the population sizes are small. A change from 2 to 3 % identification may look significant on a graph without the information you get from error bars. Some of the number differences could be due to data collection techniques and differences in the populations chosen for interview. But you made a good point that larger data sets are important. I realize I am asking technical questions that may be confusing to your audience. Still, for this sort of topic we must be as rigorous as possible, if we use this data to support arguments, or even to celebrate too much. Thank you for your work! Very interesting.
So interesting. Touchy subject to cover but oh so important. Thank you!