Transgender identity: How much has it increased?
We finally have hard data
Over the past few years, many have speculated that more young people now identify as transgender.
For some, this guess is based on their personal observations, which of course are often restricted to certain neighborhoods or schools. Others have cited the large increases in the number of youth and adults being treated for gender dysphoria, but these increases could be caused by the greater availability of treatment and diagnosis.
To determine if more people identify as transgender, we need data from a large national survey conducted over several years. It’s important that the survey is large because the transgender population has often been estimated to be less than 1%, sometimes less than ½ of 1%. Having many people in the sample is necessary for an accurate estimate. It’s important to draw from a survey collected across years because then we can see how transgender identification has changed – not just, for example, that it is more common among younger people than older, which could be caused by age instead.
We finally have that type of data. In a new paper, Brooke Wells, Jennifer Le, Nic Rider, and I analyzed data from nearly 2 million American adults who completed the CDC’s nationally representative Behavioral Risk Factor Surveillance Survey (BRFSS). (Note that all respondents are 18 or older, so this data can show us trends among adults, but not among children or teens.)
This survey has asked people if they identify as transgender since 2014. Data were available up to 2022 when we wrote the paper. Here, I also include the 2023 data, which was just released a few weeks ago.
Among all adults, identifying as transgender increased from .53% (5 out of 1,000) in 2014 to .89% (9 out of 1,000) in 2023. That’s a 68% increase – considerable, but not the orders of magnitude seen in the number of people being treated for gender dysphoria. And even in 2023 the number of American adults identifying as transgender is still less than 1%. So far it looks like the changes are substantial, but not huge.
But what happens when we look at trends within age groups? This will better answer the question of whether identifying as transgender has increased among younger adults and if there is a generational shift.
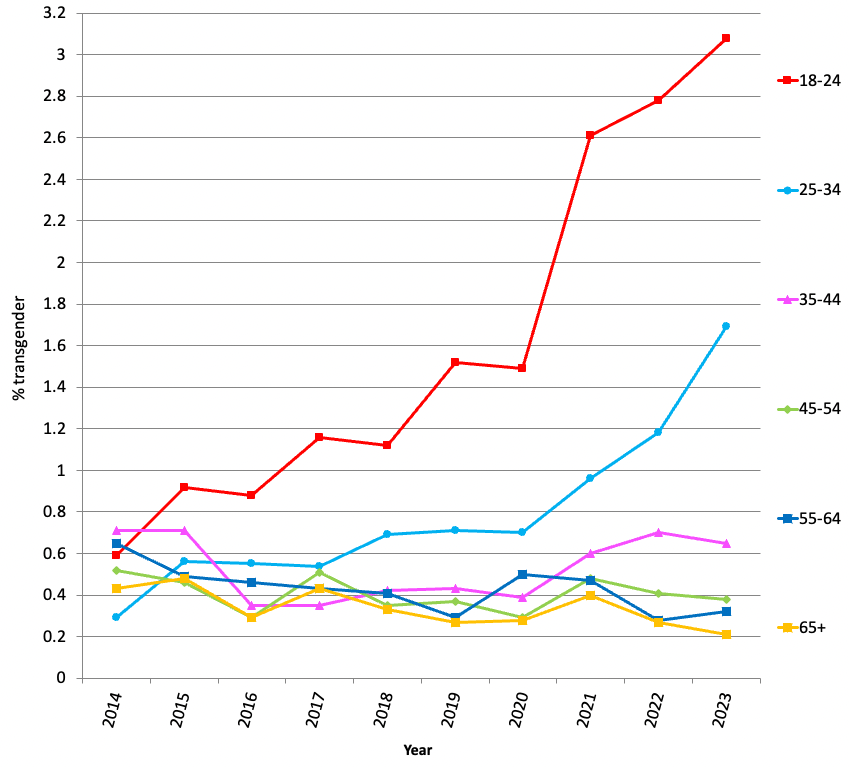
Here, the increases are much larger. Among 18- to 24-year-olds, identifying as transgender has gone from .59% in 2014 to 3.08% in 2023 – which means it has quintupled (increased by a factor of 5) in less than a decade, a 422% increase.
Figure 1: Percent of U.S. adults identifying as transgender, by age group, 2014-2023. Source: Behavioral Risk Surveillance Survey, CDC. Similar to Figure 6.5 in Generations
Identifying as transgender has also quintupled among Americans ages 25 to 34, though their sheer numbers (1.69%) are lower.
But that’s where the increases end. Among 35- to 44-year-olds, identifying as transgender went down 2014-16, was flat for several years, and then up 2020-23, with the end result that there was little change between 2014 and 2023. Identifying as transgender actually went down 2014-2023 among those 45 and older.
This is a clear generational shift: When 18- to 24-year-olds were Millennials in 2014, there were few if any age/generational differences in identifying as transgender. In 2014, there were few discernible differences in identifying as transgender by age group. But by 2023, when all 18- to 24-year-olds were Gen Z, nearly ten times more identified as transgender than 45- to 54-year-olds (Gen X). Five times more Gen Z young adults identified as transgender than 35- to 44-year-olds (older Millennials). This was not a time period effect (a cultural change that impacts everyone of all ages in a similar way).
Another way of looking at this is by birth year. There’s a sudden shift in transgender identification the 1980s-born to the 1990s-born, and then the rise accelerates around the transition from Millennials to Gen Z in the 1995-97 birth years (see Figure 2). Among the youngest, there’s a jump of almost a full percentage point from those born 2002-03 to those born 2004-05.
Figure 2: Percent of U.S. adults identifying as transgender, by birth year. Source: Behavioral Risk Surveillance Survey, CDC.
Until 2020, the number of young adults identifying as transgender gender non-conforming, transgender men (“female to male” in the wording of the survey), and transgender women (“male to female” in the survey) were fairly similar. By 2021, the increases were much larger among the gender non-conforming and transgender men. That mitigated somewhat by 2023, with the number identifying as transgender women increasing again (see Figure 3).
Figure 3: Percent of U.S. 18- to 24-year-olds identifying as transgender gender non-conforming, transgender men, and transgender women. Source: Behavioral Risk Surveillance Survey, CDC. Similar to Figure 6.7 in Generations
Among young adults, identifying as transgender gender non-conforming increased 1260% (a factor of 13.6) between 2014 and 2023, identifying as a transgender man increased 309% (quadrupling), and identifying as a transgender woman increased 204% (tripling).
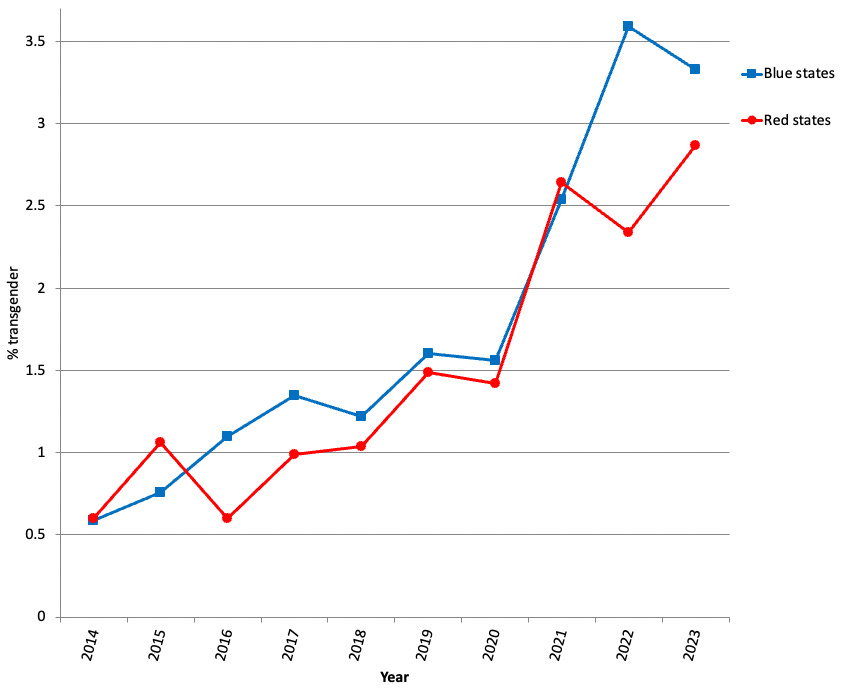
Some have suggested that identifying as transgender is considerably more common in blue (liberal) states than in red (conservative) states, and that any increase in identification would be much larger in blue states. Up to 2021, that was not true at all – identifying as transgender increased in lockstep in both blue states and red. In 2022 they diverged somewhat but then came closer again in 2023 (see Figure 4). The end result is that identifying as transgender among young adults increased 464% in blue states and 378% in red states between 2014 and 2023.
Figure 4: Percent of U.S. 18- to 24-year-olds identifying as transgender, by state of residence, 2014-2023. Source: Behavioral Risk Surveillance Survey, CDC. Similar to Figure 6.8 in Generations. Note: Red vs. blue states are determined by the results of the 2016 presidential election.
Until 2020, the increase in young adults identifying as transgender didn’t vary tremendously by race or ethnicity. That changed in 2021, and since then the increase has been much more pronounced among Whites (see Figure 5). More than 4%, about 1 out of 23, White young adults identified as transgender in 2023.
Figure 5: Percent of U.S. 18- to 24-year-olds identifying as transgender, by race and ethnicity, 2014-2023. Source: Behavioral Risk Surveillance Survey, CDC. Note: The bigger ups and downs for Black Americans may be related to smaller sample size.
Between 2014 and 2023, 1024% more White young adults (11 times more) identified as transgender, compared to 181% more Hispanic young adults (nearly tripling) and 115% more Black young adults (doubling).
What everyone wants to know, of course, is why the number of young adults identifying as transgender has increased so much. I’ll cover that in my next post.


Looking forward to the next post on the reasons for all this. I imagine the difference in red and blue states can be largely explained with the advent of restrictions on pediatric gender medicine in red states, which came around near the time of the divergence. Probably plenty to unpack there, including the claim from trans activists of a rash of suicides if these minors don't have that access.
I am also interested in the older generations actually going down in trans IDs. My first thought was people getting tired of pretending to be the other sex, but someone on X had a grim hypothesis. Could it be early deaths in that period of life? We have seen studies on the long term effects of synthetic testosterone in natal females inducing early menopausal symptoms. Hormones are powerful, we don't have good data on long-term effects when pumped into opposite sexed bodies. It would be interesting to see if anyone is looking at that.
Thanks for this research