Have some teens benefited in the era of social media?
If so, depression rates should decline in some groups, especially LGB and marginalized teens. But they don't.
“How universal are these trends -- do they show up across all groups?”
That’s one of the most frequent questions I get when I give talks on teen mental health.
It’s an important question for at least two reasons. First, understanding the universality of the increase in teen depression since 2012 may help us identify a cause. If the increase is limited to or more pronounced in particular groups, that would suggest it’s caused by something impacting that group more than others.
For example, if the surge in teen depression was caused by the lingering effects of the Great Recession on less advantaged families, the increase should be larger among less advantaged teens. If it were caused by the loss of manufacturing and farm jobs or increases in midlife mortality, increases should be larger in rural areas and in the Midwest and less or nonexistent in the West.
But if the uptick in teen depression is instead caused by the rise of smartphones and social media, trends should be fairly universal across groups. The one exception: Increases should be larger among girls, as they spend more time on social media and their use is more strongly linked to depression.
Second, some have maintained that teens from marginalized groups have benefited from the connection social media provides. This often appears as the argument that the impact of social media is “nuanced,” academia-speak for “it depends” or “it’s complicated.” In other words, growing up in the age of social media might influence depression differently depending on factors such as race and ethnicity, social class, and sexual orientation.
If so, trends in depression should be different among teens in marginalized groups. If, for example, Black teens have as a group benefitted from spending more time on social media, their rates of depression should decline or at least not increase as much as the rates among White teens.
A similar argument has been made for LGBT teens seeking connection and information online, with some saying social media is “a lifeline” for LGBT teens. Although that may be true for some individual youth, I’ll explore a different question in this post: Whether the mental health of LGBT teens has improved on average as social media became more accessible and pervasive.
Overall, it’s important to see whether the rise in teen depression touches all groups, or if it’s only showing up in certain pockets of the population. So what do the trends look like across different groups?
Let’s begin with region. The increase in depressive symptoms among teens since 2012 is virtually identical among those living in rural areas versus urban and suburban areas (see Figure 1).
Figure 1: Percent of U.S. teens with high depressive symptoms, by rural vs. urban residence, 1991-2022. Source: Monitoring the Future. NOTE: Teens are enrolled in 8th, 10th, or 12th grade and are thus 13 to 18 years old. Urban = residence in a Metropolitan Statistical Area (MSA), which includes cities and suburbs. Rural = residence in an area not part of an MSA. Depressive symptoms measured with 6 items on a 5-point Likert scale. A mean score of 3 or above indicates neutral to strongly agree on the depression items and corresponds to the ~80th percentile of the entire sample.
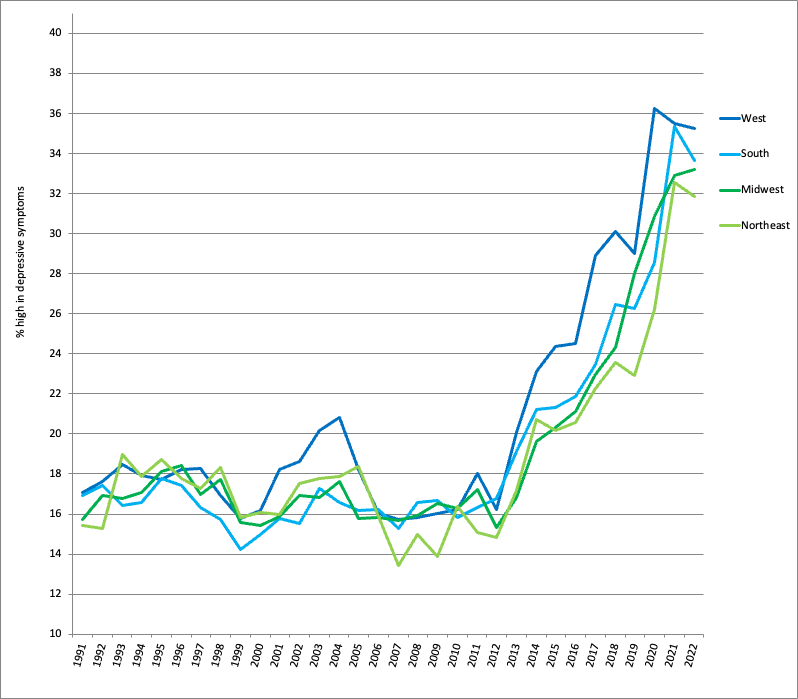
The increase in depression is also very similar among teens living in regions across the U.S. (see Figure 2).
Figure 2: Percent of U.S. teens with high depressive symptoms, by region, 1991-2022. Source: Monitoring the Future.
This suggests a national cause for the increase rather than something more regional such as the opioid crisis or economic shifts in the Midwest.
The trends are also very similar across racial and ethnic groups. If historically marginalized groups (here, Black and Hispanic teens) are benefitting from greater access to social media, it’s not showing up in their rates of depression, which have increased in a very similar pattern to White teens’ (see Figure 3).
Figure 3: Percent of U.S. teens with high depressive symptoms, by race and ethnicity, 1991-2022. Source: Monitoring the Future. NOTE: The survey began measuring Hispanic ethnicity in 2005; before this year it only measured race as Black and White.
Could other factors have deteriorated for Hispanic and Black teens over this time, perhaps mitigating any benefits of the growth of social media? Perhaps, but what? Most indicators instead trended positive over this time. The poverty rate for Black children and teens declined sharply between 2010 and 2022 (see Figure 3.16 in Generations). Hispanic teens increasingly went to college over this time (see Figure 4.31 in Generations). It seems unlikely that negative impacts of Trump’s presidency on Black or Hispanic Americans are the cause, given the increases begin around 2012 when Obama was about to be elected to a second term.
The trends are also very similar by social class, aka socioeconomic status or SES (see Figure 4). Although there is a main effect (lower SES teens are more likely to be depressed than higher SES teens), rates of depression increase at about the same rate in both groups. That points away from causes impacting less advantaged teens more than more advantaged teens, instead suggesting a cause impacting both.
Figure 4: Percent of U.S. teens with high depressive symptoms, by socioeconomic status, 1991-2022. Source: Monitoring the Future. NOTE: Higher SES = mother has a four-year college degree or more. Lower SES = mother does not have a four-year college degree. Mother’s education used as it has less missing data than father’s education.
Overall, the increases in teen depression are about the same among historically marginalized groups as they are among less marginalized groups.
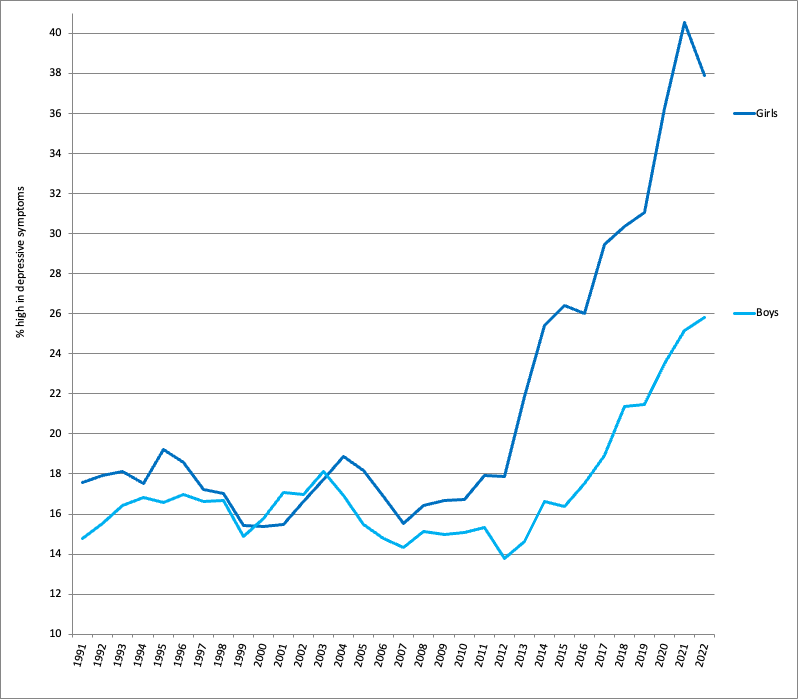
Where we finally do see a difference is with gender: The increase in depression is more pronounced among teen girls than among teen boys (see Figure 5). This difference also appears in suicide rates, which have increased more among teen girls than among teen boys.
Figure 4: Percent of U.S. teens with high depressive symptoms, by gender, 1991-2022. Source: Monitoring the Future.
What about sexual orientation? It’s commonly argued that LGBT teens gain mental health benefits from social media access. If that is true for LGBT teens as a group, their rates of depression should decline — or at least increase less than straight teens’ — as social media became more widespread.
We can’t use the same survey as above, since it doesn’t ask about LGBT identification. Another does, though only back to 2015, and just about sexual orientation (meaning we’re getting only the LGB – lesbian, gay, and bisexual -- part of the group).
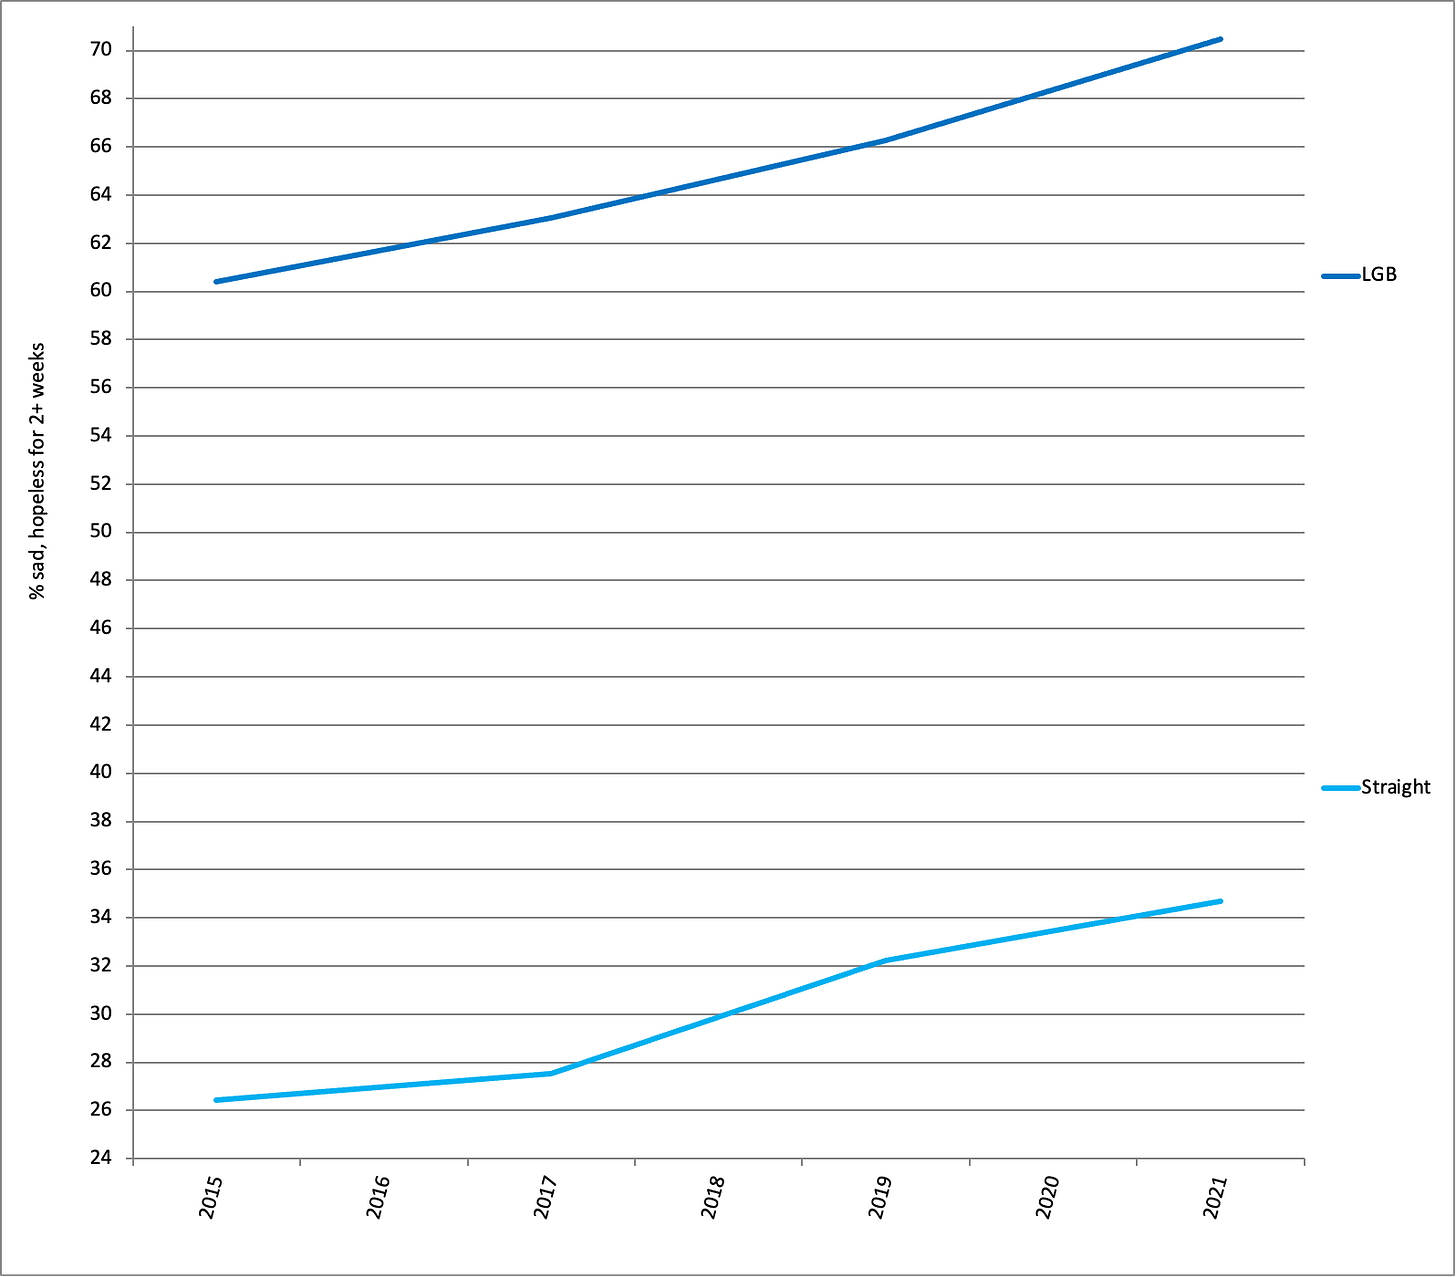
The result: Between 2015 and 2021, depression increased among both LGB and straight teens (see Figure 6). Depression rates increased 10 percentage points among LGB teens, and 8 percentage points among straight teens.
Figure 6: Percent of U.S. high school students who have been depressed in the last year, 2015-2021. Source: Youth Risk Behavior Surveillance System, CDC. NOTE: The question asks, “During the past 12 months, did you ever feel so sad or hopeless almost every day for two weeks or more in a row that you stopped doing some usual activities?” Includes 9th through 12th graders, 14 to 18 years old.
Even if the rise of social media was beneficial for LGB teens, perhaps other factors got worse for them, leading to more depression instead of less. What those factors are is a mystery, however, as this time period was an era of progress for LGB people. Same-sex marriage was legalized in 2015, and public support for it grew 10 percentage points from 2015 to 2021. Employment discrimination against LGB people was outlawed by the Supreme Court in 2020. More teens identified as LGB over this time period (see Figure 6.12 in Generations), suggesting greater acceptance and a larger group of LGB peers, both of which should be good for mental health.
It seems much more likely that both LGB and straight teens were affected by the same trends: More time online, less time with friends in person, and less time sleeping. That’s a terrible formula for mental health no matter what your sexual orientation.
The graph also illustrates the very high rates of depression among LGB teens compared to straight teens. LGB teens face many challenges, including high rates of bullying, even in this more accepting age. That deserves our attention. However, it seems unlikely that the answer is more time on social media, especially as the average teen already spends 5 hours a day on social media.
The decade from 2012 to 2022 had many positive trends, perhaps especially for teens in historically marginalized groups. Child poverty, discrimination against LGB people, and teen pregnancy all declined. The negatives, such as the increases in mortality among parent-aged adults, were much more common in some areas than others. Yet depression increased among American teens regardless of urban vs. rural residence, region, race, ethnicity, social class, or sexual orientation. That strongly suggests a cause cross-cutting all of these groups. The increasing dominance of smartphones and social media during this decade did just that.


